
Site added
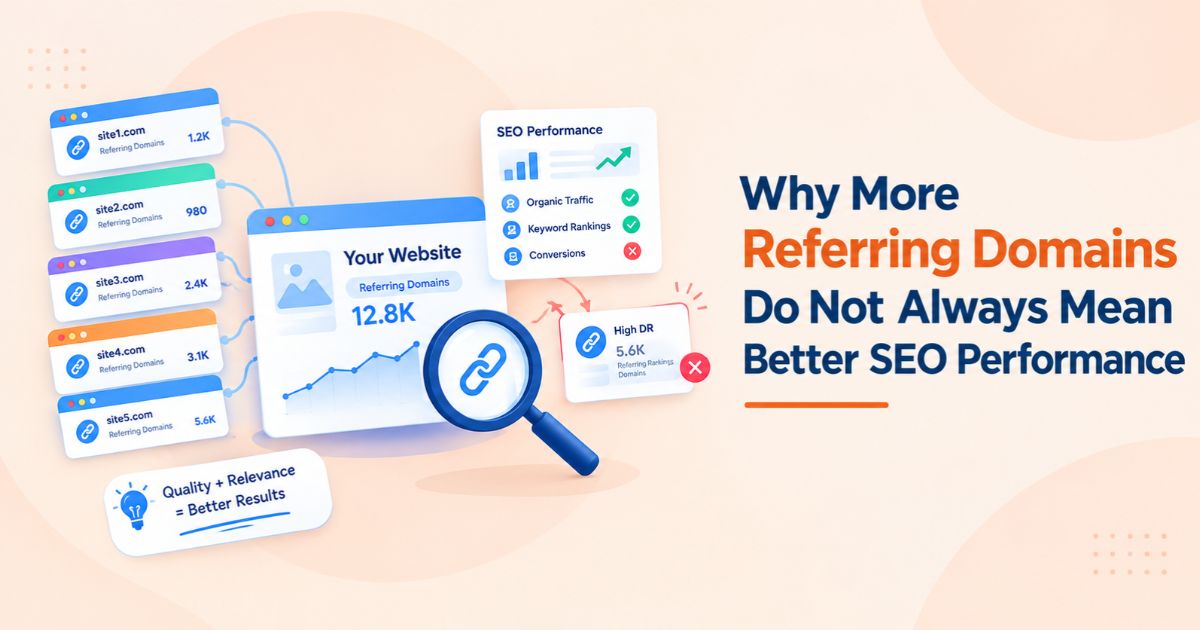
Picture the monthly report: referring domains are up, the link-building invoice is paid, and organic clicks are flat. Or lower than before. The instinct is to blame the links, or to buy more of them. Both reactions skip the diagnosis.
|
Quick answer More referring domains do not always improve SEO because the count only tells you how many sites link to you. It does not tell you whether those links are relevant, indexed, trusted, pointed at pages that match search intent, or strong enough to outweigh other ranking factors such as content, technical health, algorithm updates, and seasonality. Diagnose first, then decide whether to build, fix, or pause links. |
Key takeaways
• A referring-domain count measures quantity. Relevance, indexation, audience, and target-page fit decide whether a link moves rankings.
• Flat visibility after link growth has many possible causes. Rule out seasonality, indexing, technical, and update-related causes before blaming the links.
• Compare pages that received links against similar pages that did not. That is the cleanest test of whether links changed anything.
• Price is not quality. Compare cost and quality metrics together before buying more placements.
What a referring-domain count measures (and what it cannot)
A referring domain is a unique website that links to you. A backlink is any single link. Five hundred links from twenty sites is five hundred backlinks but twenty referring domains. Unique referring domains is the better of the two numbers because it avoids counting sitewide or repeated links from one source many times.
Even so, it remains a count. It does not record:
• whether the linking site covers a topic related to yours
• whether the linking page is indexed, and whether anyone visits it
• where the link sits on the page and which attribute it carries
• which of your pages receives the link, and whether that page matches what searchers want
Each backlink tool also crawls its own index, so the same site can show different referring-domain totals in different tools. Treat the number as a trend line inside one tool, not as a score.
There is a policy side too. Google’s spam policies define link spam as creating links primarily to manipulate rankings, and list buying or selling links for ranking purposes as an example. The same page says buying and selling links is a normal part of the web’s economy for advertising and sponsorship, and is not a violation when the links are qualified with a nofollow or sponsored attribute. Google also states that it detects violations through automated systems and, when needed, human review. A growing referring-domain count built on followed paid links is therefore not automatically an asset.
Seven reasons referring domains grow while visibility stays flat
|
Cause |
What it looks like |
Quick check |
|
1. Links from irrelevant sites |
Referring domains rise, but the linking pages cover unrelated topics. |
Sample 20 linking pages. Does each one discuss a subject close to the page it links to? |
|
2. Linking sites have little real audience |
Impressive DR, almost no organic traffic on the linking site. |
Check the linking site’s estimated organic traffic next to DR. Never use DR alone. |
|
3. Links point at the wrong pages |
Most links land on the homepage, while the pages meant to rank get none. Or the linked page does not match the query’s intent. |
Map every new link to its target URL, then compare that page with what currently ranks for its main query. |
|
4. Internal linking does not pass value onward |
The linked page is deep in the site, orphaned or barely linked internally. |
Crawl the site and count internal links to each target page. |
|
5. Links or pages are not indexed |
The link is live but the linking page, or your own target page, is not in Google’s index. |
Run URL Inspection on the target page and an index check on the linking page. See live but not indexed backlinks. |
|
6. Non-link factors dominate |
Content gaps, changed search intent, technical errors, ranking updates, seasonality, or more answers shown directly in results. |
Use the Search Console comparison steps in the next section. |
|
7. The link pattern looks manufactured |
Repeated exact-match anchors, many links from the same network, followed paid placements. |
Review anchor distribution and the Manual actions report in Search Console. |
A note on site quality in link marketplaces
Reason 2 is not hypothetical. BuzzStream’s 2026 analysis of guest post sites listed in one link vendor’s database rated 96.2% of them Low Quality under its DR-and-traffic framework, and found that 39.6% averaged zero monthly organic traffic. That is one vendor database, not the whole web, but it shows why buying by DR alone can add referring domains without adding audience. Source: BuzzStream, The Cost of Guest Posts.
How to investigate a weak campaign without assuming links caused it
Google’s guide to debugging drops in Search traffic is a good backbone. Adapt it like this:
1. Set the timeline. In the Search Console Performance report, set the date range to 16 months and compare year over year. If the same dip happened last year, it is seasonality, not links. Mark every link go-live date on the chart.
2. Read the impressions and clicks pattern. If both fell, look at ranking, indexing, and demand. If impressions held but clicks fell, the problem is more likely titles, snippets, or search features that take the click.
3. Rule out the non-link causes first. Check the Manual actions and Security issues reports, the Page indexing and Crawl stats reports, Google’s list of ranking updates, and Google Trends for the queries that lost traffic.
4. Find where the loss sits. Compare periods in the Pages table and sort by clicks difference. Is it the whole site, one group of pages, or a single page? A site-wide pattern points to technical or quality causes; a narrow one points to specific pages.
5. Audit the links themselves. Sample the new referring domains using the checklist below.
6. Run a treated-versus-control comparison. Take pages that received new links and similar pages that did not, and compare their clicks and positions over the same window. If both groups moved the same way, something other than the links is driving the result.
7. Allow for lag, then decide. Google notes that changes to a site can take anywhere from a few days to several months to show an effect, so judge in windows of weeks, not days. Then choose: fix, pause, or continue.
|
What you find |
What it likely means |
What to do |
|
Treated and control pages move together |
Links are not the main driver right now |
Fix content, intent or technical issues first |
|
Links point mostly at the homepage |
Value is not reaching pages meant to rank |
Point future links at intent-matched pages and strengthen internal links |
|
Linking pages are unindexed or have no traffic |
Links carry little audience or discovery value |
Replace with relevant, indexed, trafficked placements |
|
Clicks fell while impressions held |
Snippet, title or result-feature change |
Rewrite titles and snippets; review the results page |
|
Manual action or security issue reported |
Policy or site-health problem |
Resolve it before building any more links |
Link audit checklist for every new referring domain
• Topic fit: the linking page discusses something closely related to the page it links to.
• Real audience: set a minimum organic-traffic threshold alongside DR, so authority metrics are never the only filter.
• Indexed: the linking page appears in Google’s index.
• Placement: the link sits in body content, not in a footer, sidebar or widget distributed across many sites.
• Attribute: paid or sponsored placements carry the attribute Google asks for (nofollow or sponsored).
• Anchor text mix: keep a natural spread of branded, bare-URL, generic and descriptive anchors rather than repeating one exact-match phrase.
• Site history: screen the publisher for spam or penalty signals such as a sudden traffic collapse, off-topic content or a heavy “write for us” footprint.
• Target page: the receiving page matches search intent and has internal links pointing to it.
For a deeper look at authority metrics, see how to identify artificially inflated domain authority before building links.
Compare price and quality before buying more links
If the audit shows you need better placements, buy on evidence. A guest post price comparison tool shows what the same placement costs across marketplaces, with quality metrics beside the price, so you are not judging a link by its invoice alone.
For context, BuzzStream’s 2026 data puts the average guest post at $295 when bought directly from a site and $461 through a typical vendor, rising to an average of $3,130 for high-quality sites and $6,018 for top-tier sites through a vendor. Those averages describe one dataset, and the same site can be priced very differently by different sellers. That gap is exactly why comparison matters, and why price should never stand in for quality.
WeblinkBuzz is a free backlink price comparison tool that lets you search a domain and compare guest post and backlink prices across 22+ marketplaces, with DR, DA, organic traffic, referring domains, and niche data side by side. Use it to shortlist candidates, then run the checklist above before you buy. If you are vetting a whole prospect list, the bulk price checker handles many domains at once, and the competitor analysis tool shows which referring domains sit behind competitors that are outranking you.
Conclusion: treat referring domains as an input, not a result
Referring domains are worth tracking, but they are an input to your SEO, not proof that it is working. When link counts climb and visibility does not, work through the timeline, indexing, page-level patterns, the link audit, and a control comparison before changing the budget. Often the fix is better targeting, stronger internal links, or better content, not more links.
When you do buy, compare what the same placement costs across marketplaces and weigh it against audience and relevance. You can do that on WeblinkBuzz in a few minutes, then spend the savings on placements that fit the pages you actually want to rank.